Daten mit Paradox- Fragezeichen
18.05.2014 | Christian Vartian
Der Ausgang der Indischen Wahl ist dagegen gut für Gold. Die Kernwählerschaft der siegreichen, hinduistischen Partei besteht aus sehr Gold-freundlichem Mittelstand. Der Druck auf die Regierung, die Importsteuern auf Gold zu reduzieren bis ganz abzuschaffen, wird steigen.
Zum Thema Indien und Goldpreis sei hier eine Analyse von mir mit Zeitverzögerung widergegeben:
Indian Policy of imposing import taxes on Gold was the key driver for creating what I call the "other type of bubble-risk" in Gold, because the then nr. 1 importer suddenly cutted imports. It is similar as if the S&P 500 standing at 1870 $ sees suddenly fast deteriorating profits by the underlying companies. We do not talk about a risk because of high prices in either case, we talk about a risk which occurs by a fast change in factors that form a quote together with the price and change suddenly.
Bei den Aktienindizes hat unsere Vorhersage, dass vor allem die Pattern Recognition, sehr wohl aber auch unterstützt durch Ukraine - bedingte internationale Veränderungen in den Finanzströmen, einen Vorsprung für den CH-SMI gegenüber anderen Indizes induziert.
Korrelationen sehen wird derzeit keine relevanten: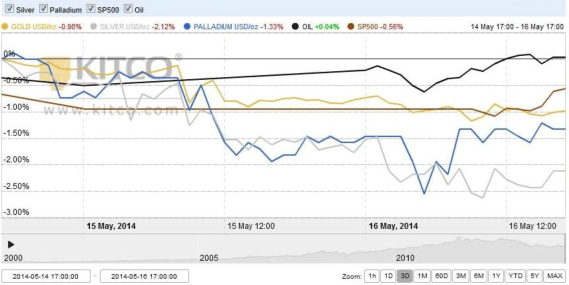
und dies liegt an Daten, welche Fragezeichen dahingehend hinterlassen, wie sie zusammen auftreten können:
1) US- Inflation:
Der Producer Price Index ist ein wesentlicher Inflationsindikator. Der April Core PPI kam mit 0,5% vs. 0,2% Konsensus viel höher als erwartet. Letzte Woche kamen die Q1 unit labor costs (Stückkosten) mit 4,2% vs. 2,5% Konsensus ebenfalls viel höher als erwartet. Die Kapazitätsauslastung fiel aber leicht und liegt noch bei unter 80%, während die Beschäftigungskosten im 1. Quartal eher fielen:
Quelle: Econoday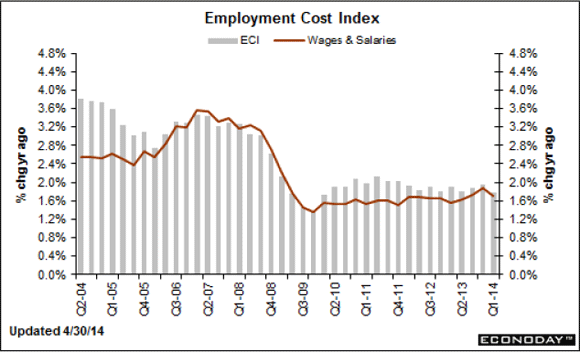
Nur an keineswegs muskulös gestiegenden Rohstoffpreisen kann das unmöglich liegen.
Der Konsumentenpreisindex kam mit 0,2% vs. 0,2% Konsensus und bestätigte nicht. Daraufhin fiel Gold unter 1300 $, der PPI wurde vom Managed Money und Produzenten ignoriert, es wurde insgesamt "ent-longt". Das Smart Money - (wenn überhaupt, dann im CoT-Report unter "other Reportables" zu finden, ansonsten nur mit Pattern Recognition ermittelbar) - und Commercial Smart Money (Swap Dealer) gingen aber long. Die CME sah sich aufgrund des traurigen Marktvolumens veranlasst, die Margins u.a. auf Gold und Silber zu senken (Details finden Sie auf der CME-Webpage).
Wir enthielten uns jeder Art von Absicherung, Hedgen ist keine kurzfristige Spielerei, wenn sich zwei Sichtweisen gegenüberstehen.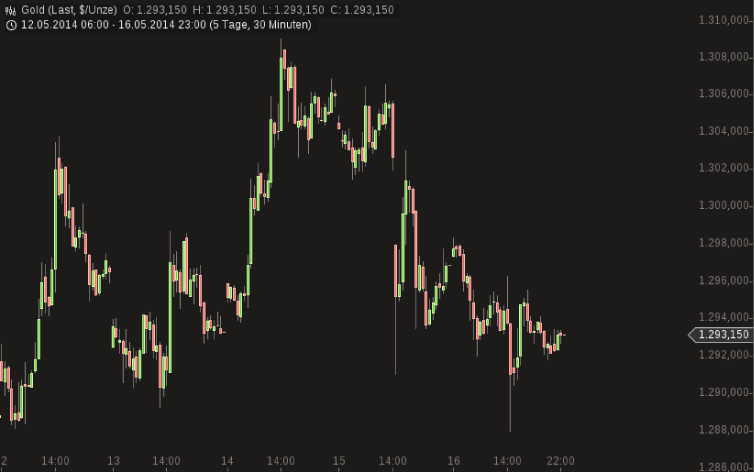
Man kann in die Nähe von 1280 $ einen Wasserfall-Verhinderungs-Sell-to Open Stopp einbauen, enger ist bei diesen Spinnenbeinen nicht sinnvoll. Wir hedgten gar nicht.
2)US-Immobilien
Hier kam eine für Gold nicht gute Jubelmeldung zu den US-Housing Starts:
Die April Housing Starts kamen mit 1072 K vs. 975 K Konsensus und die Baugenehmigungen mit 1080 K vs. 1008 K Konsensus, beide also besser, als erwartet.
In den USA ist die Holzbauweise vorherrschend, was sagt der Bauholzpreis dazu?: 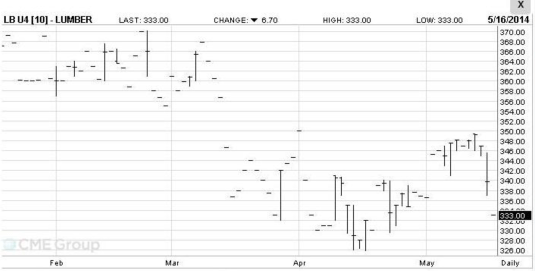
Er bestätigt nicht!
Vielmehr sinkt das Vertrauen der US-Hausbauer auf das tiefste Niveau seit einem Jahr: (Quelle: Bloomberg):
"Confidence among U.S. homebuilders dropped in May to the lowest level in a year, showing the residential real estate market may be slow to recover after an unusually harsh winter. The National Association of Home Builders/Wells Fargo builder sentiment gauge fell to 45 this month, the weakest since May 2013."
Dazu sind die Verkäufe von gebrauchen Häusern schwach bis rückläufig und die US-Hypothekenbanken, voran der JPM- Gruppe und der Wells Fargo reduzieren das Personal in deren Hypothekenabteilungen. Die Bank of America hatte wegen schwachem Hypothekengeschäftes gar einen merklichen Dämpfer im Ergebnis des 1. Quartals.
3) Die Zinsen sinken, trotz anderslautenden ZB- Ankündigungen und "QE"3 Reduktionsaktionen in den USA. Ein Rückgang der Kreditnachfrage.
Es ist dieser Punkt 3, welcher, wenn überhaupt die zwei Paradoxe erklären kann.
S&P 500 resistance levels bei 1875, 1900 und 1925; support levels bei 1850, 1837 und 1825.
Zum Thema Aktienindizes sei hier abschließend eine Analyse von mir mit Zeitverzögerung widergegeben:
As data show, the S&P 500 earnings yield (like other major indices) is well above any bond yield of reasonably rated bonds. This gives a comfortable safety reserve to shares.
Yet, this is a fundamental look and what is missing here is the dynamics of HOW the earnings rose since 2012.
Please forget about Lehman and 2008 for a while in the sense of their contribution to a crash, which happened. The crash of 2008 was succeeded by very strong quantitative easing till June 2011 (The US-FED QE2 expired in June 2011). During this period (second half of 2009 to fall 2011) liquidity repaired most of the damage of the Lehman crash and we saw a period similar (yet faster than) to the years 2003 to mid 2008. Naturally shares rose WITH commodities and WITH precious metals in all those periods. In these periods, liquidity drove both the ability to buy shares as well as the ability to buy more products from the companies listed on the stock market but it also drove their commodity cost up. Let us call it BUYING POWER DRIVEN.
The US-downgrade in Summer 2011 and especially a very heavy Chinese tightening of monetary policy since summer 2011 led slowly to a decline in commodities and especially since the start of QE3 to a decline in bonds too (look to the rising US-Treasury-Yield in the first half of 2013). Now shares walked on the other leg. It was capital flows from other asset classes that drove shares up and on the company side it was savings on cost that drove the profit of the companies up (lower commodities are cost savings, wage cuts are cost savings
). As a result, the Earnings Yield of the S&P 500 continued to be very reasonable. Let us call this COST CUT DRIVEN. Consequently, shares continued their rise but AGAINST commodities and especially AGAINST precious metals.
The earnings yield curve as well as most news you read suggests therefore a bull market in shares since 2010 till now. In reality, the BUYING POWER DRIVEN bull market in shares ended in 2012 (like the one for precious metals and commodities). In our view, a different bull market in shares took over immediately, the COST CUT DRIVEN bull market.
This means that share investment is still attractive, yet you will have to speed up your reaction time to avoid a correction. Why? Because COST CUT DRIVEN profit increases last only shortly by nature. Further profit increase is only possible if BUYING POWER DRIVEN. We got surprising indicators from US last week with very seriously increasing unit cost (this is inflationary) that indicated that the COST CUT DRIVEN bull market is very near to its end.
Where do we stand?
Fundamentally the cross ratio of the S&P 500 earnings yield vs. the bond yield is very OK still. Also, shares are much more scarse than gold, nobody issues shares (if credit capital is so cheap). These fundamentals are real. But one must look very carefully to HOW the profits rose lately and watch for very fast deterioration of their growth and this is in the cards because first indicators show that the cost cutting is over.
Even at current levels of share prices and even of they would not rise further, a deterioration of the profit of the underlying companies can crash the earnings yield even under a bond yield with devastating results. And because of above logic, you will NEVER SEE THIS IN CHARTS BEFOE, because it will not come from the share price corner, it will come from the earnings corner (and of course end up in the share prices correction).
Do we predict a crash in share prices? Absolutely not. We predict a mechanism:
The inversity between share prices and precious metals prices should also end at this moment.
We will inform our main customers individually and right on time.
Stand Vartian Edelmetallindex: Au 44%, Ag 7%, Pd 39%, Pt 10%.
© Mag. Christian Vartian
www.gip-ag.ch
Das hier Geschriebene ist keinerlei Veranlagungsempfehlung und es wird jede Haftung für daraus abgeleitete Handlungen des Lesers ausgeschlossen. Es dient der ausschließlichen Information des Lesers.