Die 9 Wellenebenen im Dow Jones
09.09.1999 | Jürgen Küßner
- So etwas sieht man nur einmal im Leben -
Es gibt massenweise Indizien, nahezu Beweise, für jemanden, der sich der allgemeinen Masseneuphorie entziehen kann und die Historie studiert hat, daß nun endlich auch der Dow Jones ABSOLUT OBEN ANGEKOMMEN SIND (die breite Zahl der US-Aktien ist ja bereits seit April 1998 in einem Bear-Market).
Diese Indizien habe ich zuhauf an anderer Stelle genannt. Nur einen Punkt möchte ich hier noch einmal aufgreifen: Die immer dünner werdende Marktbreite des Anstiegs.
Die Advance-Decline-Linie spricht Bände: Sehen Sie dazu die separate Analyse an.
(Anmerkung GoldSeiten.de: Analyse hier eingefügt!)
- - - - - - - - - - - - - - - - - - - - -
Schon vor längerer Zeit habe ich in der Langfristanalyse des Dow Jones auf die extreme Divergenz zwischen den großen Aktienindizes und der advance-decline-Linie der New Yorker Börse hingewiesen.
Hier der Chart von Ende Mai 1999 mit dem Dow Jones:
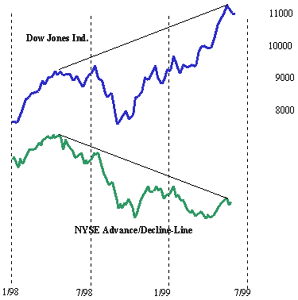
Hier ist nun eine Aktualisierung. Die Divergenz, verdeutlicht mit den roten Linien, ist extrem.
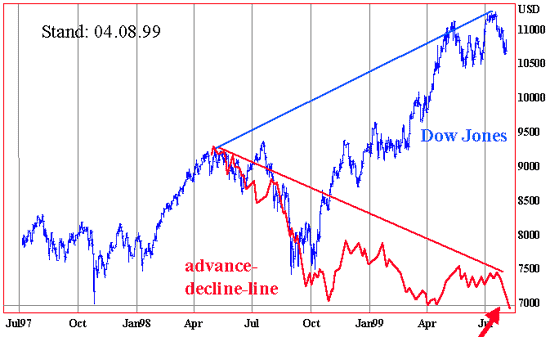
Die a/d-line hat vorgestern (03.08.) ihren Tiefstand von Ende Oktober 1998 und gestern (04.08.) auch den etwas tieferen von April 1999 unterschritten.
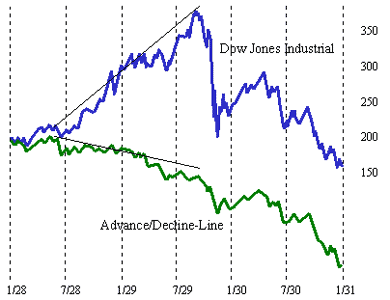
Wer, wie ich, daran glaubt, daß das Verhalten der Menschen an den Märkten sich nicht grundsätzlich geändert hat, sollte ein wenig erschreckt sein von dieser Ähnlichkeit.
Ein paar Fakten von 1929: Vom 2. Januar bis zum 3. September (dem damaligen Höchsstand) waren nur 388 der damals 1.200 New Yorker Aktien gestiegen, während 600 bereits deutlich von ihren Höchstständen gefallen waren. Pepsi Cola stand z. B. bei 10 $ von 19 $ und Philip Morris war bereits von 41 $ auf 12 $ gefallen.
- - - - - - - - - - - - - - - - - - - - -
Um zu verstehen, warum der Dow (wahrscheinlich) sein TOP hinter sich hat, muss man wissen, wie die Aufwärtsbewegung bis dorthin ausgesehen hat. Schauen wir also zurück - bis zum Jahre 1700 (!).
Zu den folgenden Charts muß ich sagen, daß ich sie mit viel Mühe zusammengesucht, gescannt und nachgezeichnet habe. Gewisse Vereinfachungen der Kurven beim Zeichnen bitte ich daher zu entschuldigen. Die wesentlichen Bewegungen sind aber erfaßt.
Nehmen Sie sich ein wenig Zeit, um alle Charts anzusehen und zu verstehen.
Beginnen wir mit dem "supergroßen" Bild, einem Chart von Aktienkursen seit 1700 (die Kurse vor 1789 stammen aus England, danach sind es US-Kurse umgerechnet auf den Dow Jones Index, und seit gut 100 Jahren gibt es ja den Dow selbst).
Diesen folgenden Chart verdanken wir der "Foundation for the Study of Cycles".
Kritiker erwähnen zwar, daß man Aktienkurse von England vor 1789 mit denen der USA ab 1789 nicht vergleichen könne, und daß auch die Zeit vor Existenz des Dow Jones nicht mit der Zeit danach vergleichbar ist. Dies ist aus Sicht der Elliott-Wellen jedoch irrelevant, denn zum einen war die USA in den Anfängen hauptsächlich von Europa, besonders England geprägt ("New" York) und damit stark verbunden, zum anderen geht es hier um Jahrhundert-Zyklen, die die menschliche Masenpsychologie abbilden - egal ob es sich um amerikanische oder englische Menschen handelt.
Sonst könnte man ja auch argumentieren, daß spätestens alle 50 Jahre die historischen Charts wertlos seien, denn die Menschen, die diese Charts "verursacht" haben, leben dann ja nicht mehr. Die Natur und die Psychologie der Menschen hat sich nicht verändert, das weiß auch Alan Greenspan. In seiner Rede am 27. August 1999 hat er es zum Ausdruck gebracht.
Alan Greenspan Rede am 27.05.1999
Am 27. August 1999 hielt Alan Greenspan, US-Notenbankchef, eine Rede in Jackson Hole, Wyoming, vor einer Delegation von Notenbankern. Veranstaltet wurde dieses Symposium von der Federal Reserve Bank of Kansas City.
Diese Rede, dessen Text gleich in Original folgt (mit Hervorhebungen von mir), ist eine einzige Warnung vor einer Umkehr der derzeitigen Aktieneuphorie und der Sorglosigkeit gegenüber Risiken. In vielen Punkten spricht Greenspan mir regelrecht aus der Seele, indem er auf die psychologischen Aspekte der Aktien-Bubble eingeht.
Seine Warnungen sind so deutlich, daß der Markt sofort regelrecht einbrechen müßte, aber der Dow Jones verliert bisher "nur" 90 Punkte. Deutlich wird auch (ganz am Ende), daß der Aktienmarkt das eigentliche Ziel seiner Zinserhöhungen ist.
Am Besten gefallen mir seine Aussagen,
- daß Marktpreismuster sich kaum verändern ("market price patterns remain much the same") und
- die menschliche Natur sich über Generationen kaum verändert ("like so many other aspects of human nature, has not materially changed over the generations"). Auch spricht er von "Wellen von Optimismus und Pessimismus", vom "Herdentrieb" und von "überzogenen Gewinnerwartungen".
DANKE, ALAN !
HOFFENTLICH GLAUBT MAN D I R !
Original in englischer Sprache:
Remarks by Chairman Alan Greenspan
New challenges for monetary policy
Before a symposium sponsored by the Federal Reserve Bank of Kansas City in Jackson Hole, Wyoming August 27, 1999
I should like as a backdrop to this conference on the challenges confronting monetary policy to focus on certain aspects of one of the issues that will be more broadly discussed later this morning: asset pricing and macroeconomic performance.
As the value of assets and liabilities have risen relative to income, we have been confronted with the potential for our economies to exhibit larger and perhaps more abrupt responses to changes in factors affecting the balance sheets of households and businesses. As a result, our analytic tools are going to have to increasingly focus on changes in asset values and resulting balance sheet variations if we are to understand these important economic forces. Central bankers, in particular, are going to have to be able to ascertain how changes in the balance sheets of economic actors influence real economic activity and, hence, affect appropriate macroeconomic policies.
At root, all asset values rest on perceptions of the future. A motor vehicle assembly plant is a pile of junk if no participants in a market economy perceive it capable of turning out cars and trucks of use to consumers and profit to producers. Likewise, the scrap value at the end of the plant's service life will be positive only if it is convertible into usable products.
The value ascribed to any asset is a discounted value of future expected returns, even if no market participant consciously makes that calculation. In principle, forward discounting lies behind the valuation of all assets, from an apple that is about to be consumed to a hydroelectric plant with a hundred-year life expectancy.
On such judgments of value rest much of our economic system. Doubtless, valuations are shaped in part, perhaps in large part, by the economic process itself. But history suggests that they also reflect waves of optimism and pessimism that can be touched off by seemingly small exogenous events.
This morning, I plan to address some of the problems that arise in evaluating the prices of equities. I should like to first focus on some significant difficulties of profit accounting that impede judgments about prospective earnings. In particular, there are some difficulties that have become more severe as a consequence of the recent acceleration of technologies, which, in turn, are markedly altering patterns of economic organization and production. And then I will discuss a different set of forces that mold the development of discount factors which, together with earnings projections, produce estimates of market value.
First, the rapid shift in the composition of gross domestic product toward idea-based value added is muddying our measures of current earnings and, hence, our projections of future earnings.
The key definitional question that must be confronted is, What is a capital outlay? Conversely, What is an expense that, by definition, is consumed in the process of production and deemed an intermediate product? This issue is most immediately evident in accounting for software outlays, but it is rapidly expanding to a much broader range of activities.
Software that is embedded in capital equipment, and some that is stand-alone, is currently being capitalized and consequently amortized against current and future earnings. But a substantial portion of software spending is expensed, even though the equity prices of the purchasing companies are clearly valuing the software outlays as contributing to earnings over their useful economic lives--the relevant criterion for capitalizing an asset.
There has always been a fuzzy dividing line between what is expensed and what is capitalized. This has historically bedeviled the accounting for research and development, for example. But the major technological advances of recent years have exposed a wide swath of rapidly growing outlays that, arguably, should be capitalized so that the returns they produce would be more accurately reflected as earnings over time. Indeed, there is even an argument for capitalizing new ideas, such as different ways of organizing production, that enhance the value of a firm without any associated outlays. Some analysts judge the size of undercapitalized outlays as quite large.
The important point, however, is that decisions about which items to expense will have important consequences for reported earnings. In general, if the trend of expensed items that should be capitalized is rising faster than reported earnings, switching to capitalizing these items will almost always accelerate the growth in earnings. The reverse, of course, is also true.
But the newer technologies, and the productivity and bull stock market they have fostered, are also accentuating some accounting difficulties that tend to bias up reported earnings. One is the apparent overestimate of earnings that occurs as a result of the distortion in the accounting for stock options. The combination of not charging their fair value against income, and the practice of periodically repricing those options that fall significantly out of the money, serves to understate ongoing labor compensation charges against corporate earnings. This distortion, all elseequal, has overstated growth of reported profits according to Fed staff calculations by one to two percentage points annually during the past five years. Similarly, the rise in stock prices, which reduces corporate contributions to pension funds is also augmenting reported profits. These upward adjustments in reported earnings, of course, are a consequence of rising stock prices and, hence, may not be of the same dimension in the future.
Nonetheless, it is reasonable to surmise that undercapitalized expenses have been rising sufficiently faster than reported earnings to have more than offset the factors that have temporarily augmented reported earnings. It does not seem likely, however, even should all of the appropriate accounting adjustments to earnings be made, that such adjustments can be the central explanation of the extraordinary increase in stock prices over the past five years.
However we calculate profits and capital, shifts in the stock market value of firms will doubtless continue to remain important influences on our economies. It is thus incumbent on us to improve our understanding of the process by which projections of future earnings are translated into asset market value.
Even our most sophisticated analytic techniques have difficulty dealing with the interactions among time preference, risk aversion, and uncertainty and with the implications of these interactions for the risk premiums that are embedded in asset prices. It is our failure to anticipate changes in this discounting process that much of our inability to accurately forecast economic events lies. For example, the dramatic changes in information technology that have enabled businesses to embrace the techniques of just-in-time inventory management appear to have reduced that part of the business cycle that is attributable to inventory fluctuations and, accordingly, may well have been a factor in the apparent decline in equity premiums that has characterized the latter part of the 1990s. Whether the decline in these premiums themselves may foster activities that could result in wider business cycles, as some maintain, is an open question.
As model builders know, all economic channels of influence are not of equal power to engender growth or contraction. Of crucial importance, and still most elusive, is arguably the behavior of asset markets. More broadly, there is an increasing need to integrate into our macro models more complete descriptions of the responses of households and businesses to risk--behaviors that are generally modeled separately under the rubric of portfolio risk management.
The translation of value judgments into market prices is, of course, rooted in how people discount uncertain future outcomes. An individual's degree of risk aversion may vary through time and possibly be subject to herd instincts. Nonetheless, certain stable magnitudes are inferable from the process of discounting of future claims and values.
One of the most enduring is that interest rates, as far back as we can measure, appear trendless, despite vast changes in technology, life expectancy, and economic organization. British long-term government interest rates, for example, mostly ranged between three percent and six percent from the early eighteenth century to the early twentieth century, and are around five percent today. Indeed, scattered evidence dating back to ancient Rome and before reflects the same order of interest rate magnitude, not a one percent interest rate nor 200 percent.
This suggests that the rate of time preference underlying interest rates, like so many other aspects of human nature, has not materially changed over the generations. But while time preference may appear to be relatively stable over history, perceptions of risk and uncertainty, which couple with time preference to create discount factors, obviously vary widely, as does liquidity preference, itself a function of uncertainty.
The impact of increasing uncertainty and risk aversion was no more evident than in the crisis that gripped financial markets last autumn, following the Russian default.
That episode of investor fright has largely dissipated. But left unanswered is the question of why such episodes erupt in the first place.
It has become evident time and again that when events are unexpected, more complex, and move more rapidly than is the norm, human beings become less able to cope. The failure to be able to comprehend external events almost invariably induces fear and, hence, disengagement from an activity, whether it be entering a dark room or taking positions in markets. And attempts to disengage from markets that are net long the most general case--means bids are hit and prices fall.
Modern quantitative approaches to risk measurement and risk management take as their starting point historical experience with market price fluctuations, which is statistically summarized in probability distributions. We live in what is, for the most part, a stable economic system, where market imbalances that produce unusual outcomes almost always give rise to continuous and inevitable moves back toward longer-run equilibrium. However, the violence of the responses to what seemed to be relatively mild imbalances in Southeast Asia in 1997 and throughout the global economy in August and September of 1998 has illustrated yet again that the adjustments in asset markets can be discontinuous, especially when investors hold highly leveraged positions and when views about long term equilibria are not firmly held.
Enough investors usually adopt strategies that take account of longer-run tendencies to foster the propensity for convergence toward equilibrium. But from time to time, this process has broken down as investors suffer an abrupt collapse of comprehension of, and confidence in, future economic events. It is almost as though, like a dam under mounting water pressure, confidence appears normal until the moment it is breached.
Risk aversion in such an instance rises dramatically, and deliberate trading strategies are replaced by rising fear-induced disengagement. Yield spreads on relatively risky assets widen dramatically. In the more extreme manifestation, the inability to differentiate among degrees of risk drives trading strategies to ever-more-liquid instruments so investors can immediately reverse decisions at minimum cost should that be required. As a consequence, even among riskless assets, such as U.S. Treasury securities, liquidity premiums rise sharply as investors seek the heavily traded "on-the-run" issues a behavior that was so evident last fall.
History tells us that sharp reversals in confidence happen abruptly, most often with little advance notice. These reversals can be self-reinforcing processes that can compress sizable adjustments into a very short time period. Panic market reactions are characterized by dramatic shifts in behavior to minimize short-term losses. Claims on far distant future values are discounted to insignificance.
What is so intriguing is that this type of behavior has characterized human interaction with little appreciable difference over the generations. Whether Dutch tulip bulbs or Russian equities, the market price patterns remain much the same.
We can readily describe this process, but, to date, economists have been unable to anticipate sharp reversals in confidence. Collapsing confidence is generally described as a bursting bubble, an event incontrovertibly evident only in retrospect. To anticipate a bubble about to burst requires the forecast of a plunge in the prices of assets previously set by the judgments of millions of investors, many of whom are highly knowledgeable about the prospects for the specific companies that make up our broad stock price indexes.
If episodic recurrences of ruptured confidence are integral to the way our economy and our financial markets work now and in the future, it has significant implications for risk management and, by implication, macroeconomic modeling and monetary policy.
Probability distributions that are estimated largely, or exclusively, over cycles excluding periods of panic will underestimate the probability of extreme price movements because they fail to capture a secondary peak at the extreme negative tail that reflects the probability of occurrence of a panic. Furthermore, joint distributions estimated over periods without panics will misestimate the degree of correlation between asset returns during panics. Under these circumstances, fear and disengagement by investors often result in simultaneous declines in the values of private obligations, as investors no longer realistically differentiate among degrees of risk and liquidity, and increases in the values of riskless government securities. Consequently, the benefits of portfolio diversification will tend to be overestimated when the rare panic periods are not taken into account.
As we make progress, hopefully, toward understanding asset-pricing mechanisms, we need also to upgrade our insights into the effect of changing asset values on GDP--the so-called wealth effect.
Although many aspects of this issue deserve attention, let me cite a few open questions of particular importance.Efforts to differentiate between realized and unrealized gains, and the propensity to leverage both, may afford a deeper understanding of the consequences of asset price change. And differentiating between gains that arise from enhanced profitability and those that reflect changes in discount factors may also be useful. The former may be more likely to be sustained, given the tendencies of discount factors to revert back to historic norms.
Moreover, it is evident that borrowings against capital gains on homes influence consumer outlays beyond the effects of gains from financial assets. Preliminary work at the Federal Reserve suggests that the extraction of equity from housing has played an important role in recent years. However, stock market values and capital gains on homes are correlated and, hence, their separate effects are difficult to identify. This is an area that clearly warrants further examination.
Finally, in the business sector, questions remain about the influence of equity prices on investment spending. In particular, Do all equity price movements--whether related to fundamentals or not--have the same effect on investment spending?
In conclusion, the issues that I have touched on this morning are of increasing importance for monetary policy. We no longer have the luxury to look primarily to the flow of goods and services, as conventionally estimated, when evaluating the macroeconomic environment in which monetary policy must function. There are important--but extremely difficult--questions surrounding the behavior of asset prices and the implications of this behavior for the decisions of households and businesses. Accordingly, we have little choice but to confront the challenges posed by these questions if we are to understand better the effect of changes in balance sheets on the economy and, hence, indirectly, on monetary policy.
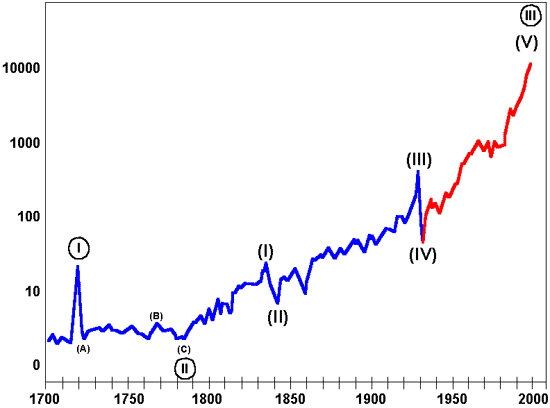
Auffallend in diesem Chart sind eigentlich nur wenige Besonderheiten:
- Die South Sea Bubble, ausgelöst durch die Gründung der South Sea Company (1711) und der Zusammenbruch 1720
- Der lange Bear-Market von 1835 - 1860 (ja, 25 Jahre!)
- Der Crash von 1929 - 1932 (auch hier dauerte es 25 Jahre bis zu einem neuen Hoch!)
- Die extreme Euphorie der Welle (V)
Kaum erkennbar: Der 1987er Crash.
Der obige Chart zeigt die "Grand-Supercycle-Wellenebene" (EBENE 1) mit den eingekreisten römischen Zahlen I bis III und den "Supercycle" mit den Wellen (I) bis (V). Solange es Aktienkurse gibt, haben sie bisher in etwa 400 Jahren 3 Wellen vollbracht. Was nun (oder sehr bald) ansteht, ist die Korrektur IV (eingekreist). Eine Welle 4 ist meist nicht sehr dramatisch, aber zeitlich recht ausgedehnt. Sie können getrost davon ausgehen, daß diese Welle 4 einige Jahrzehnte dauern wird.
Aufschlußreicher ist aber die zweite Wellenebene - (I), (II), (III), (IV), (V) - (EBENE 2), denn sie ist offenbar komplett. Nach fünf kompletten Wellen folgt typischerweise eine Korrektur zurück in den Bereich der "nächstkleineren 4", und das war die Zeit von 1929 - 1932.
Der obige Chart - wie auch alle folgenden - haben eines gemeinsam: Die jeweils letzte Welle, Welle 5, ist rot gezeichnet, denn im jeweils nachfolgenden Chart wird dieser Teil genauer, d. h. vergrößert betrachtet.
Gehen wir also zur nächsten Wellenebene (EBENE 3):

Dies also ist nur der letzte Teil des vorigen Gesamtbildes. Was sehen wir: Wieder fünf komplette Wellen. Sehr eindrucksvoll die historische Super-Hausse der 80er und vor allem der 90er Jahre, die selbst den letzten davon überzeugt hat, daß Aktien immer nur steigen.
Gehen wir weiter, indem wir uns die Hausse seit 1974 genauer betrachten (EBENE 4):

Und wieder fünf Wellen, mit dem 87er Crash als Welle 4.
Weiter geht's, mit der Bewegung seit 1987 (EBENE 5):

Wieder fünf Wellen, ebenfalls komplett. Aber es kommt noch mehr, schließlich zeige ich Ihnen ja 10 Wellenebenen.
Nun also das Stück seit September 1998 (EBENE 6):
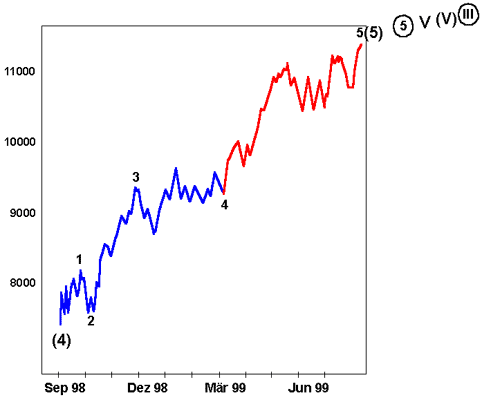
Es wird schon langweilig: Wieder fünf Wellen, davon Welle 5 sehr lang.
Und nun zum nächsten Teil - die Welle 5 seit März 1999 (EBENE 7):
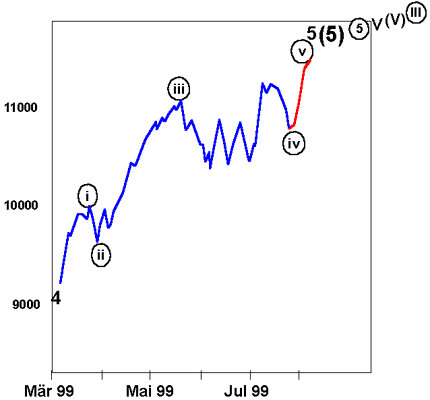
Wer würde sich noch wundern über - wieder fünf Wellen.
Es ist aber noch nicht zu Ende. Das rote Teilstück seit Anfang August 1999 sieht so aus (EBENE 8):
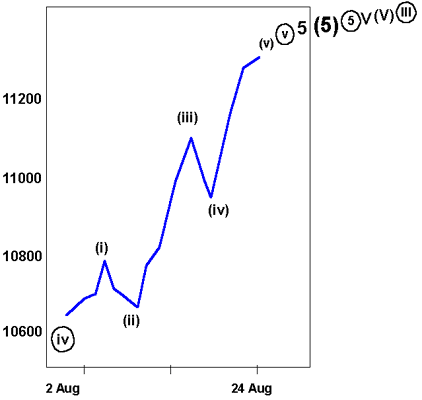
Wieder ......
Und immer und immer wieder das gleiche fünfteilige Muster mit ähnlichen Proportionen!
Wer das alles für Zufall hält, muß ein Träumer sein. Vom 69-Minuten-Chart bis zum Jahrhunderte-Chart immer das gleiche Bild. Der fraktale Aufbau ist frappierend. Frappierend ist auch, das ALLE fünften Wellen - bis zum 60-Minuten-Bereich - ausgeweitet waren. Das gleiche gilt übrigens auch für alle dritten Wellen, aber auf die Vergößerung habe ich hier verzichtet.
Und jetzt müßten Sie verstanden haben, warum ich davon ausgehe, daß der Dow Jones
- in den nächsten Jahren auf 1.000 oder gar bis 400 Punkte fallen wird.
Wer sich nur mit den letzten paar Jahren der Geschichte beschäftigt hat, hat lediglich gelernt, daß Korrekturen
- selten vorkommen,
- nicht schlimm sind und
- schnell wieder aufgeholt sind.
Wer aber alle 9 Wellenebenen kennt, weiß, daß die jetzt anstehende Korrektur zurückgeht bis zur "nächstkleineren 4" - und das sind gleich acht oder neun Vieren! Und sie werden alle nacheinander erreicht werden.
Dies war nur die reine Elliott-Wellen-Theorie, die natürlich unglaubhaft erscheint. Für einen erfahrenen Elliotter ist diese Analyse allein genug, um sie für möglich, ja für sehr wahrscheinlich zu halten. Wenn ich also hier die Elliott-Wellen in reiner Form vertreten würde, bräuchte ich nur diese eine Seite. Trotzdem habe ich noch viele andere technische und globalwirtschaftliche Aspekte analysiert, die diese gewagte These unterstützen.
Der ganze Rest meiner Pages dient also nur als "Beiwerk".
© Jürgen Küßner
www.Elliott-Waves.de